DOGE Price Prediction: Analyzing Technicals and Market Sentiment for Investment Potential

#DOGE
- Technical indicators show mixed signals with MACD bullish but price below moving average.
- Market sentiment is influenced by whale accumulation and volatility, suggesting long-term confidence.
- Critical support at $0.208 could determine near-term price direction, with upside targets toward $0.74.
DOGE Price Prediction
Technical Analysis: DOGEUSDT Trading Pair
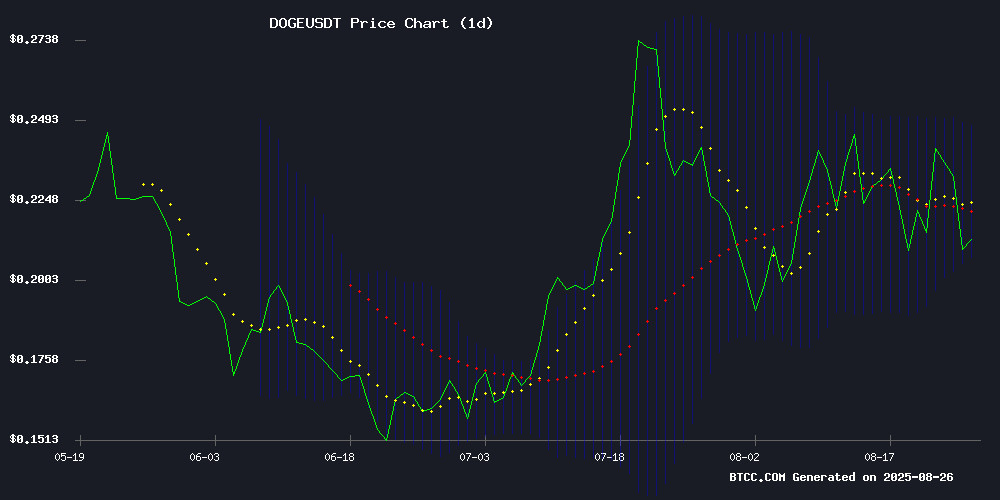
According to BTCC financial analyst Mia, DOGE is currently trading at $0.2182, below its 20-day moving average of $0.2276, indicating short-term bearish pressure. However, the MACD shows a positive crossover with a reading of 0.003771, suggesting potential upward momentum. The Bollinger Bands position the price NEAR the lower band at $0.208, which could act as support. If DOGE holds above this level, we might see a rebound toward the middle band at $0.2276.
Market Sentiment: Whale Activity and Price Targets
BTCC financial analyst Mia notes that recent whale accumulations during market corrections signal long-term confidence in DOGE. News headlines highlight a bull-bear battle around critical support levels, with volatility surging due to large transfers. While there's uncertainty in the short term, the technical breakout potential eyes the all-time high of $0.73905, aligning with the positive MACD signal from technical analysis.
Factors Influencing DOGE's Price
Dogecoin (DOGE) Price Prediction: Critical Support Tested Amid Bull-Bear Battle
Dogecoin's price hovers at a pivotal juncture as bulls defend the $0.20 support level against persistent bearish pressure. Market analyst @Morecryptoonl identifies this threshold as the foundation of current market structure—a breach could extend the correction phase, while holding may reignite upward momentum.
Two technical scenarios emerge: either a fresh 1-2 wave rally signaling renewed bullish strength, or a temporary B-wave bounce before further consolidation. Fibonacci retracement levels at $0.2117 (61.8%) and $0.2011 (78.6%) loom as potential reversal zones for traders seeking entry points.
Should $0.20 hold, upside targets include Fibonacci extensions at $0.2810 (100%), $0.3017 (123.6%), and $0.3386 (161.8%). The memecoin's August low remains in play, with the next 48 hours likely determining whether Dogecoin resumes its uptrend or faces deeper retracement.
Dogecoin Volatility Surges Amid Whale Transfers and Market Uncertainty
Dogecoin experienced significant volatility between August 24–26, swinging within a $0.013 range before stabilizing near $0.21. A sharp drop from $0.218 to $0.208 on August 25 coincided with a trading volume of 1.57 billion DOGE, while broader market pressure was attributed to a 900 million DOGE transfer to Binance. This move unsettled traders, though on-chain data reveals whales accumulated over 680 million DOGE in August, countering retail distribution.
Whale activity fueled the turbulence, with a single transfer of 900 million DOGE (worth over $200 million) sent to Binance from a long-term holding wallet. Market sentiment dipped as open interest in DOGE futures fell 8%, reflecting reduced speculative exposure. Despite the bearish signals, Fed Chair Powell's Jackson Hole remarks sparked a 12% rally across meme coins, aligning DOGE with broader risk-on momentum.
Price action saw a 6.06% spread in the 23-hour session ending August 26, with DOGE trading between $0.221 and $0.208. The most dramatic move occurred during a one-hour window on August 25, when prices fell sharply on heavy volume. The coin later rebounded from session lows of $0.210, demonstrating the split between breakdown fears and dip-buying optimism.
DOGE Price Prediction: Technical Breakout Eyes $0.73905 All-Time High
Dogecoin's market structure suggests an impending volatility expansion, with analysts identifying $0.225 as the critical inflection point. A decisive close above this level could trigger accelerated gains toward $0.288 by month-end, representing a 37% upside from current prices.
The most ambitious forecast comes from Javon Marks, projecting a 252% rally to $0.73905 should DOGE confirm a bull phase. This technical setup mirrors the 2021 parabolic advance, though requires sustained buying pressure above $0.20 support.
Divergence emerges between short-term traders targeting the $0.225-$0.288 resistance band and macro bulls anticipating all-time highs. Market depth analysis shows limited sell orders until $0.25, suggesting low-friction upward movement if initial resistance breaks.
Dogecoin Whales Accumulate Amid Market Correction, Signaling Long-Term Confidence
Dogecoin has rebounded 3% from its recent low of $0.205, following a 16% drop from its August 24 peak of $0.245. The meme coin's recovery aligns with broader market trends, but on-chain data reveals a more compelling narrative: large holders are aggressively accumulating during the dip.
Santiment metrics show the 50-day average of large DOGE transfers (over $100,000) reached a five-month high in August. Meanwhile, wallets holding 1-10 million DOGE grew by 33 to 4,288. This accumulation coincides with fundamental developments, including Thumzup's acquisition of a Dogecoin mining company and pending spot ETF approvals.
Market analysts interpret the whale activity as a bullish signal beyond speculative trading. 'These indicators show sophisticated players see value at current levels,' notes Shawn Young, highlighting institutional-grade interest in the asset.
Is DOGE a good investment?
Based on current technical data and market sentiment, DOGE presents a mixed but cautiously optimistic outlook. The price is below the 20-day MA, indicating short-term pressure, but the MACD crossover and whale accumulation suggest potential upward movement. Key levels to watch include the Bollinger Band support at $0.208 and resistance at the middle band of $0.2276. Investors should consider these factors alongside the high volatility and news-driven market sentiment.
| Metric | Value | Implication |
|---|---|---|
| Current Price | $0.2182 | Below MA, bearish short-term |
| 20-Day MA | $0.2276 | Resistance level |
| MACD | 0.003771 | Positive momentum |
| Bollinger Lower | $0.208 | Key support |
